British Prime Minister Benjamin Disraeli (1804-1881) famously said, “There are three kinds of lies: lies, damned lies, and statistics.” No fan of academic studies, he had learned how statistics can be used to make almost any point the researcher wants to make. My Grandma often quoted the 1880s version, “Figures don’t lie, but liars do figure.”
For that reason, I try not to bore those who indulge my weekly ramblings with too many statistics, though numbers sometimes illustrate more vividly than words. That can help clear away political rhetoric, so policy questions can be considered with greater clarity. There is no better example than the complex arguments regarding energy, and its impact on the climate. It is our generation’s defining environmental question, yet hopelessly mired in confusion.
An Oxford-based online publication called “Our World in Data” tracks a bewildering array of facts and figures, aiding research on major issues like poverty, disease, war and peace, and climate change. Ninety million people annually visit its website, which features thousands of interactive charts and graphs, frequently featuring a long-term layout that shows how various conditions have changed over time. I am especially intrigued by the charts tracking energy production and consumption, in various countries, over time.
For me, one conspicuous picture emerges. Namely, the United States is the only major country pursuing a completely different agenda than the rest of the world when it comes to energy. That sounds counterintuitive, since we’re often said to be citizens of the same world, and supposedly share a common interest in preserving our fragile planet. Yet considering actions, not words, that appears to be a concern almost exclusively of the U.S. That’s ironic because the U.S. is so often called the world’s worst actor, producing and consuming the most energy – the greatest threat to the globe.
Well, not so much.
Electricity use per person in the U.S. has remained surprisingly stable over the past half century, and today Americans consume almost exactly the same (80,000 kilowatt-hours annually) as they did in 1965. Total electric generation is almost twice as much as it was then, as is the population, but as individuals we are no more wasteful or abusive of energy than our parents were. In addition, America has dramatically improved its “energy intensity,” a measure of the amount of energy needed to produce each dollar of gross domestic product (GDP). Americans consumed about 3.7 kilowatt-hours per dollar in 1970, but only 1.3 today. Viewed another way, the U.S. economy is 25 times larger now but requires only a third as much energy per dollar.
What has changed, though, is the source of those kilowatt-hours. The share of our electricity generated by fossil fuels was 96 percent in 1965, but barely 81 percent today. Renewables went from four to eleven percent during those 60 years, mainly wind, solar, and hydropower.
The bigger story, though, is in the chart showing the mix just among fossil fuels sources, where coal produces less than half the electricity it did in 1985, a decline from 1,500 terawatt-hours (TWh) to just 675 today. During the same years, electricity produced from natural gas increased fivefold, from 314 to 1,800 TWh.
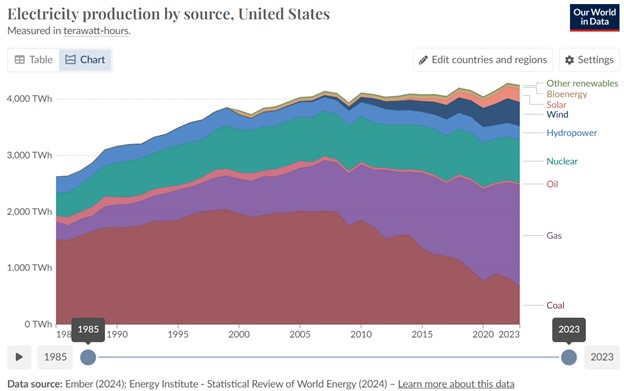
On the chart showing American electric production since 1985, the overall top line is relatively steady, increasing over time roughly with the population. The coal line plummets, the natural gas line expands, and the other sources remain about the same for five decades. This is where the picture diverges completely from the rest of the world.
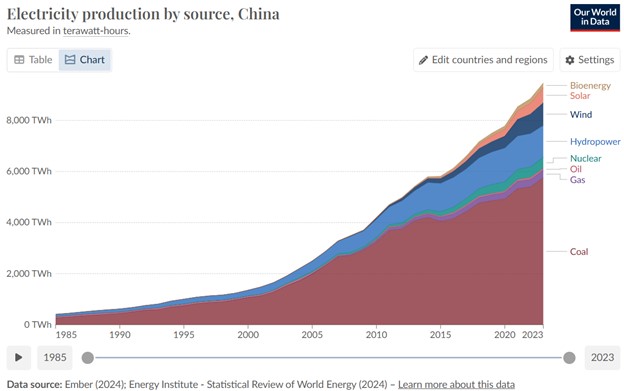
The same chart for China’s electricity production shows totals dramatically spiking, from only 410 TWh in 1985 to 9,560 today (almost a third of the entire world’s electricity). And most of the increase is from a 22-fold increase in the use of coal – while the U.S. is choking off its own coal supply. Similarly, India went from only 186 TWh of electricity in 1985 to almost 2,000 today, almost entirely fueled by increased use of coal, up 13-fold since 1985.
Worldwide, the use of coal for electricity tripled, from 3,748 TWh to 10,468 TWh during that same period. Apparently the rest of the world has discovered what Americans once appreciated – coal is the cheapest and most abundant energy source on Earth. Rhetoric notwithstanding, only the U.S. is systematically abandoning coal, pretending it might help the climate, while around the world people are enjoying a lifestyle they once only dreamed of. In other words, America is leading, but nobody is following. Those numbers do not lie.


Comments on this entry are closed.